

The Geography of Mule Account Fraud: How Hotspots Reignite Across India
Author
Vikas Chaurasia
Date Published

Mule accounts, used to receive and move fraud proceeds, do not surface randomly across India.
District-level Video KYC (VKYC) rejection data shows mule fraud concentrating in clear, predictable clusters. These hotspots flare up, cool down and shift; weeks before police action or news headlines catch on.
We mapped the footprint: how these patterns work, where they are moving, and how your risk team can act first.
Why a Rejection Rate Is a Geographic Signal
When a VKYC verification fails, the system records the reason, such as using fake documents, having someone else take the call, or suspicious behaviour. While a single rejected attempt might not seem like much, tracking these rejections across a specific district can reveal fraud before it fully unfolds.
By comparing a district's monthly rejections to its usual numbers, banks can spot warning signs early and catch mule account activity before these accounts go live.
A national reporting portal only reflects a district in which enough victims have filed complaints, those complaints having been processed, and a pattern has been aggregated centrally.
Onboarding rejection data, by contrast, is generated automatically at the moment someone attempts to open an account, with no dependency on when a victim comes forward with their case, enabling early access to the information.
How Mule Fraud Clusters Behave
Mule fraud clusters by place because mule networks are built locally.
Account holders are recruited through agents, acquaintances, and community contacts, often from the same towns and low-income groups, and recruiters work where they already have reach and trust. Hotspots built this way are anchored in people, not in a single location.
When enforcement disrupts one district, the recruiters and the supply of willing account holders do not disappear, so the operation re-establishes itself where that reach already exists, usually migrating close by.
Migration of Mule Accounts
Fraud moves for two reasons-
- Enforcement makes the flagged district costlier to operate in: accounts are frozen, agents are arrested, and banks tighten onboarding checks there.
- At the same time, the neighbouring districts offer the same community contacts, the same pool of people willing to rent out an account, and the same bank branches, with far less scrutiny.
Our 15-month study across roughly 130 districts, built on VKYC rejection telemetry from leading Indian financial institutions, surfaces patterns worth planning around.
- Spikes are short. In 81% of cases, a district's elevated rejection rate lasts exactly one month before shifting; only 6.5% persist past three.
- Fraud relocates, it does not disappear. In 39% of cases, the next hotspot appears in the same state, roughly 190 km away on average.
- Old hotspots return. In one recent quarter, 11 of the active hotspots had already been flagged earlier in the same financial year.
Small districts create noisy spikes, and big cities skew high purely on volume. To isolate real fraud signals, we filter out statistical noise using three rules:
- Call threshold: 108 to 143 monthly calls, scaled to national rejection rates.
- Volume floor: At least 30 rejected calls per month.
- Ranking: Z-score, not raw volume or rates.
This removes false alarms and reveals where fraud actually concentrates.
Applied consistently, this method flagged roughly sixteen district-level hotspots a quarter through FY26, with 85 to 90% of them later confirmed by law enforcement actions or news reporting.
How the Pattern Plays Out: Comparing Two Real Clusters
Varanasi, Uttar Pradesh, flagged in May 2026 at an 11.88% rejection rate, was confirmed roughly a month later when Operation Mule Strike broke nationally.
Malappuram, Kerala, flagged the same month at 6.29%, took closer to a full quarter to surface via Operation Cy-Hunt: 30 arrests in 12 hours, over 44,000 mule accounts blocked.
The migration pattern shows up at a cluster level too, tracing gradual regional diffusion rather than a single jump from one district to a random other. Fraud doesn't jump randomly across the map. Both clusters rippled outward from a single epicentre into neighbouring districts over several months. This movement is exactly what our pre-alert logic catches.
Teams that want to follow how these districts evolve can read the latest edition of our quarterly fraud hotspot signal report.
This tracking runs on a quarterly cycle, and Varanasi and Malappuram are only the two earliest confirmations. The same method currently flags ten districts showing early movement that has not yet reached enforcement or media attention, part of an ongoing signal report we publish each quarter.
What This Means Operationally
The action for regulators and regulated entities is straightforward:
- Pre-alert adjacent geographies the moment a district is flagged.
With clusters moving to a neighbouring district roughly 39% of the time, at an average of under 200 kilometres, a flag should raise onboarding scrutiny in the surrounding area, not just the flagged location itself.
- Re-check previously flagged districts on a quarterly cycle.
Reignition within roughly a quarter is common enough that treating a cooled-down district as resolved is a planning error, not a safe assumption.
- Track state boundaries, not administrative convenience.
Since 39% of relocations stay within the same state, a monitoring cadence organised by state, rather than by isolated district, catches the Nuh-to-Western-UP and Surat-to-Saurashtra pattern far earlier than a district-by-district review cycle would.
Conclusion
Mule account fraud in India has a location, not just a method, and that location is predictable enough to plan a monitoring calendar around. Districts that go quiet are not resolved; they are, more often than not, waiting to reignite or watching their neighbour absorb the activity instead. For risk teams building out a broader response, we break down recruitment networks, detection mechanics, and tightening compliance rules in the rest of this series.
FAQs
What is mule fraud? Mule fraud occurs when criminals use third-party bank accounts to receive, wash, and move stolen money. These accounts, either rented from individuals, bought outright, or created using fake credentials, act as buffers to break the paper trail before law enforcement can trace the cash.
Why do mule account fraud hotspots keep shifting to new districts? Enforcement disrupts local activity without eliminating the underlying network. The next hotspot usually appears in a neighbouring district within the same state, suggesting relocation rather than shutdown.
How far do mule account fraud hotspots typically move? On average, roughly 190 kilometres, and in about 39% of cases the next hotspot surfaces within the same state as the original one.
How long does a mule account fraud spike typically last in one district? 81% of elevated rejection-rate spikes last exactly one month before shifting elsewhere; only 6.5% persist beyond three months.
Do mule account fraud hotspots reappear after being flagged once? Yes. In one recent quarter studied, eleven of the active hotspots had already been flagged earlier in the same financial year, indicating a cooled-down district is not necessarily a resolved one.
How is a fraud hotspot district identified from onboarding data? By applying a statistical validity floor and a minimum fraud-volume floor to a district's monthly VKYC rejection rate, then ranking by Z-score rather than raw rate or raw volume, so neither small, noisy districts nor large cities skew the result.
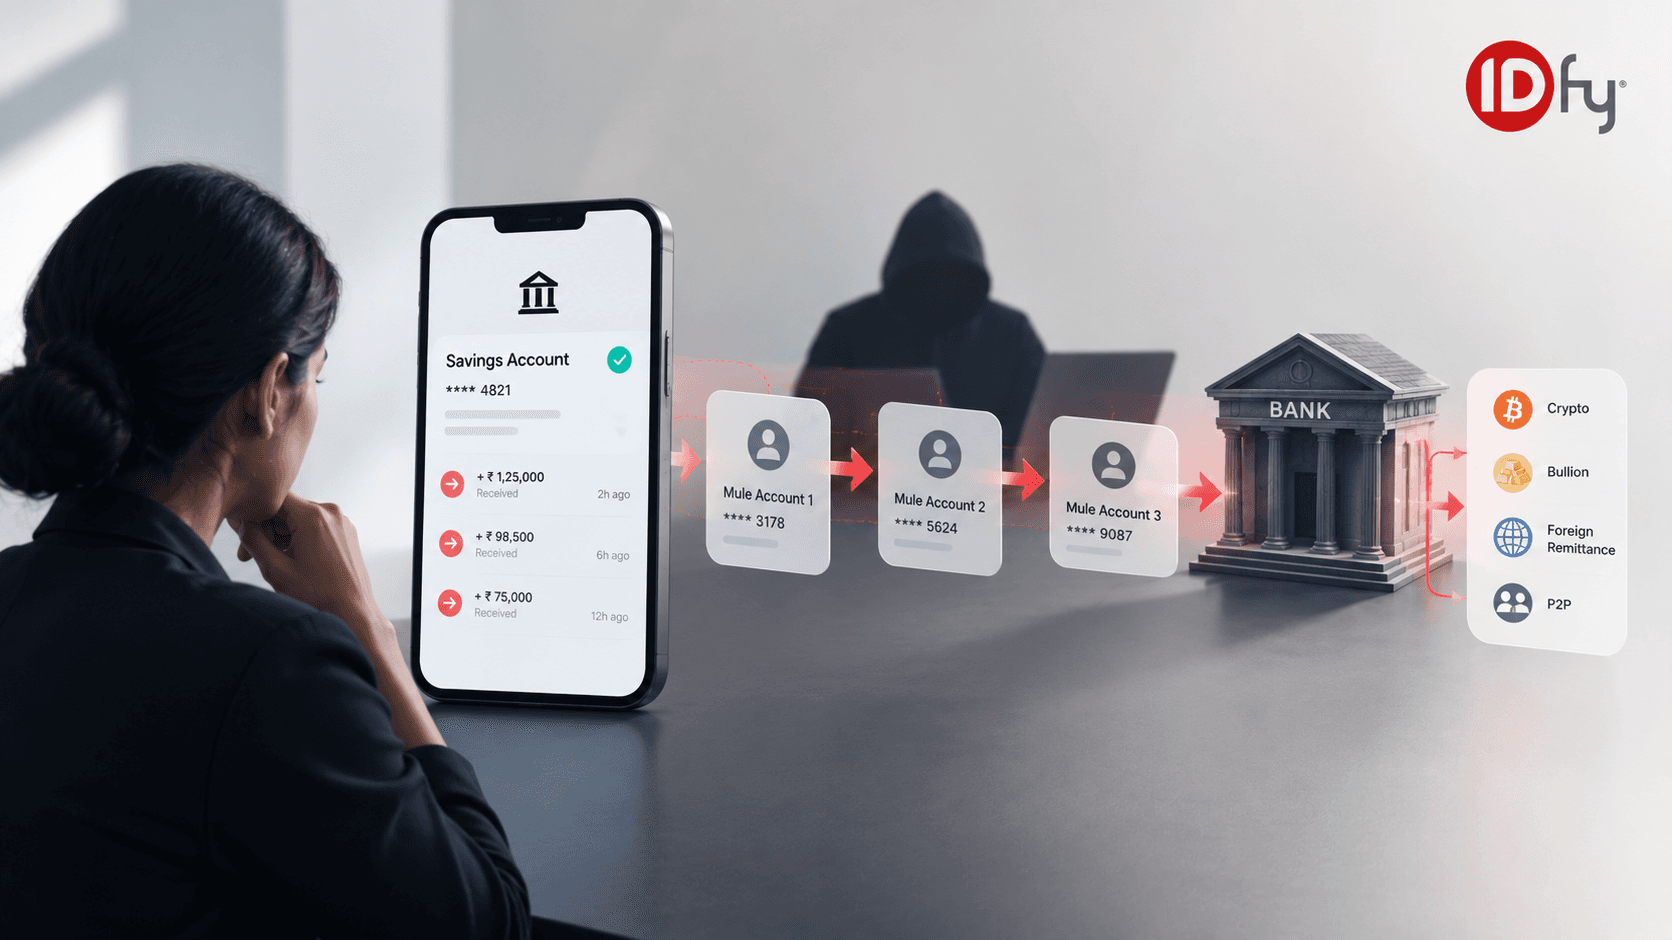
How mule accounts form, funds move through, and how banks detect them to fight back. A complete operational view of India's largest fraud channel.

How AML obligations, KYC Master Directions, and RBI's new liability framework are converging on mule accounts and what compliance teams should do now